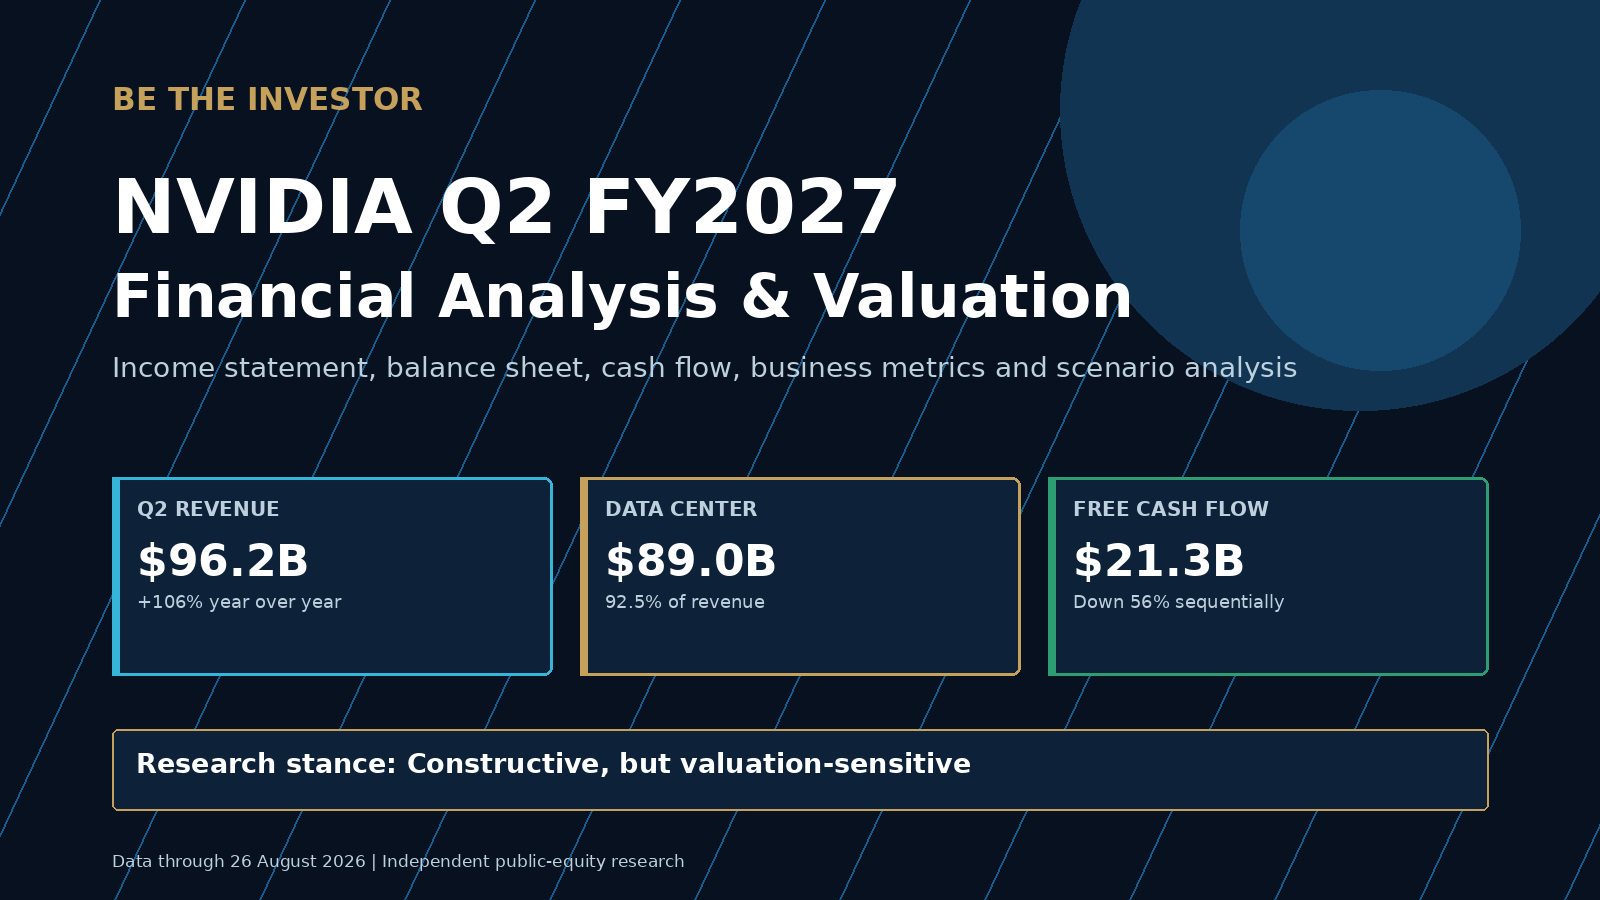
Download the full 18-page research report: NVIDIA Q2 FY2027 Investment Research — BE THE INVESTOR. The PDF includes the financial statements, cash-flow bridge, valuation scenarios, catalysts, risks and investor monitoring framework in a print-ready format.
The short answer
NVIDIA delivered an exceptional operating quarter. Q2 FY2027 revenue reached $96.22 billion, up 106% year over year, while Data Center revenue rose to $89.02 billion and represented 92.5% of total sales. GAAP operating income reached $63.73 billion, equivalent to a 66.2% operating margin. The company guided Q3 revenue to $108 billion, plus or minus 2%.
The quarter was less clean below the operating-income line and in cash flow. GAAP EPS of $2.46 included large gains on equity investments, while non-GAAP EPS was $2.22. Q2 free cash flow was $21.34 billion, down sharply from Q1 because receivables, inventory and other working-capital items absorbed cash.
The investment conclusion is therefore more nuanced than the headline growth rate. NVIDIA remains the dominant full-stack AI infrastructure platform, but the company is increasingly using its balance sheet to secure supply, support cloud capacity and accelerate customer deployments. Investors need to evaluate recurring earnings, cash conversion and contingent commitments together.
Readers can also review the live NVIDIA stock research page, NVIDIA financial statements, NVIDIA earnings data and NVIDIA valuation dashboard on BE THE INVESTOR.
Table of contents
- Key Q2 metrics
- Business and revenue mix
- Income statement
- Earnings quality
- Balance sheet
- Cash flow
- Working capital
- Growth outlook
- Commitments and guarantees
- Competition
- Valuation
- Risks and catalysts
- Investment conclusion
- Frequently asked questions
NVIDIA Q2 FY2027 key metrics
Metric Q2 FY2027 Change Investor interpretation Revenue $96.22B +106% Y/Y, +18% Q/Q Demand converted faster than expected Data Center revenue $89.02B +117% Y/Y, +18% Q/Q AI infrastructure remains the core engine Hyperscale revenue $48.71B +102% Y/Y, +13% Q/Q Large cloud platforms remain the largest buyer group AI Clouds, Industrial and Enterprise $40.31B +138% Y/Y, +25% Q/Q The faster-growing customer category Edge Computing $7.20B +27% Y/Y, +13% Q/Q Smaller but more diversified exposure GAAP gross margin 75.0% +2.6 pts Y/Y Strong pricing and operating economics GAAP operating income $63.73B +124% Y/Y 66.2% operating margin GAAP net income $59.69B +126% Y/Y Includes investment-related gains Non-GAAP net income $53.95B +105% Y/Y Better recurring earnings reference Free cash flow $21.34B -56% Q/Q Working capital absorbed substantial cash Q3 revenue guidance $108B ±2% Above pre-print consensus No China Data Center compute assumed Source: NVIDIA Q2 FY2027 earnings release and NVIDIA Q2 FY2027 Form 10-Q.
Why the quarter matters
NVIDIA did more than post another strong year-over-year comparison. Revenue exceeded the midpoint of the company’s prior guidance by $5.22 billion, or 5.7%. It also exceeded the pre-print LSEG consensus reported by Reuters by approximately 4.4%. Data Center revenue and adjusted EPS were also above the available expectation set.
The Q3 revenue midpoint of $108 billion was approximately 3.7% above the pre-print LSEG estimate reported by Reuters. That normally supports upward estimate revisions. The main offset is management’s expectation that gross margin will decline as memory, networking and system costs rise during the Vera Rubin product transition.
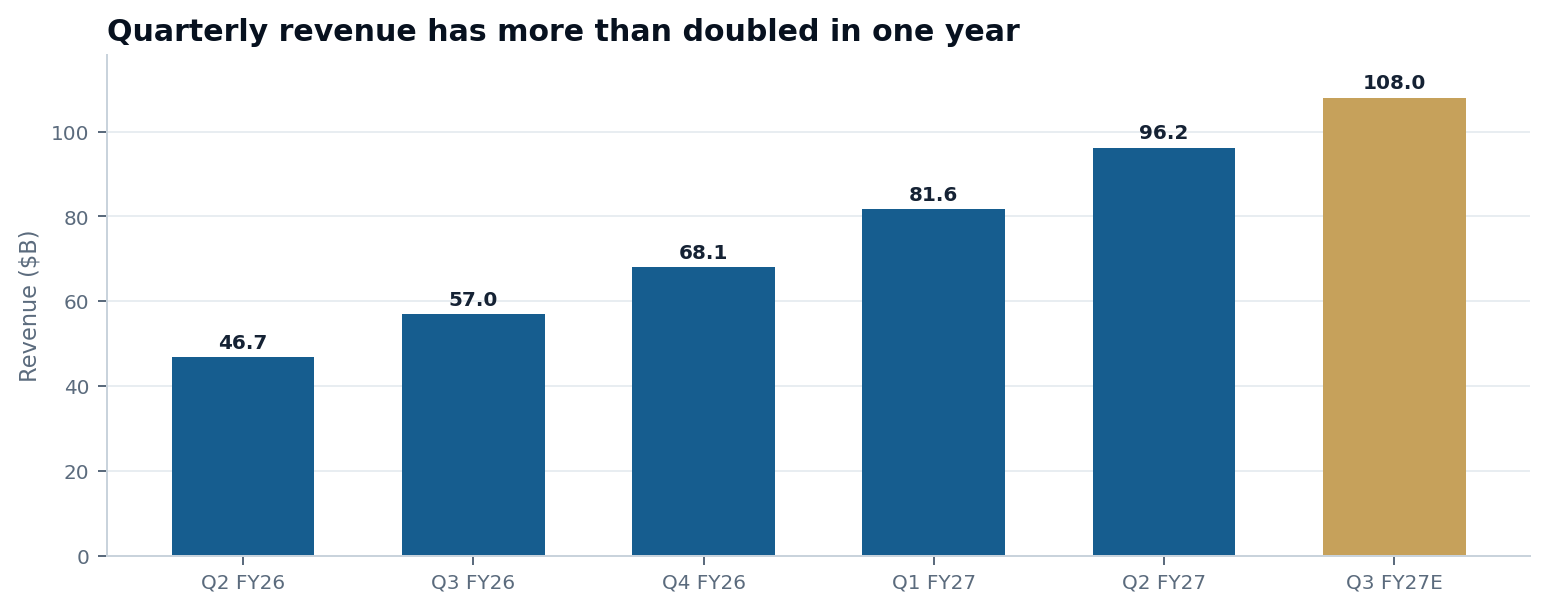 NVIDIA quarterly revenue trend through Q3 FY2027 guidance
Quarterly revenue increased from $46.74 billion in Q2 FY2026 to $96.22 billion in Q2 FY2027. Q3 FY2027 guidance is $108 billion at the midpoint.
NVIDIA is now overwhelmingly a Data Center company
The old description of NVIDIA as a gaming-chip company is no longer useful for financial analysis. In Q2 FY2027, Data Center represented 92.5% of total revenue.
NVIDIA now reports revenue through three customer and deployment categories:
- Hyperscale: $48.71 billion, or 50.6% of total revenue. This category includes the largest cloud and consumer-internet platforms.
- AI Clouds, Industrial and Enterprise: $40.31 billion, or 41.9% of revenue. It includes neoclouds, AI-native companies, sovereign customers, enterprises and industrial deployments.
- Edge Computing: $7.20 billion, or 7.5% of revenue. It includes PCs, workstations, automotive, robotics and other edge devices.
The second category grew 25% sequentially, faster than Hyperscale growth of 13%. That suggests broader deployment channels, but it does not completely eliminate customer concentration. Some AI clouds ultimately serve the same frontier model developers and large technology platforms.
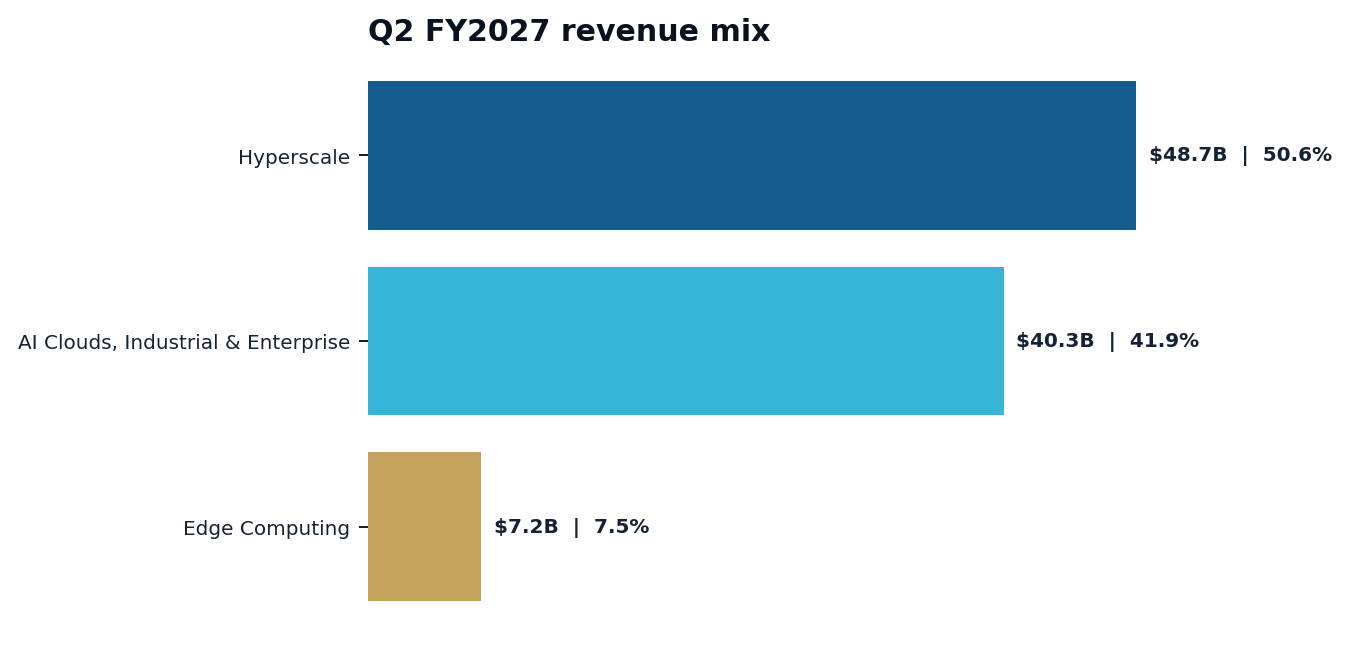 NVIDIA Q2 FY2027 revenue mix by customer category
Data Center exposure dominates NVIDIA’s revenue mix. AI Clouds, Industrial and Enterprise was the fastest-growing category sequentially.
NVIDIA’s revenue model is also becoming broader. The company sells GPUs, CPUs, networking, rack-scale systems and software as one integrated platform. This raises the revenue captured per AI-factory deployment and strengthens the economic value of the CUDA software ecosystem.
Income statement explained
An income statement answers three basic questions: how much the company sold, what it cost to deliver those products, and what profit remained after operating expenses, taxes and non-operating items.
Revenue and gross profit
NVIDIA generated $96.22 billion of revenue and incurred $24.08 billion of cost of revenue. The difference was $72.14 billion of gross profit, equal to a 75.0% gross margin.
Cost of revenue includes semiconductor manufacturing, advanced packaging, memory, systems, logistics and warranty expenses. Gross margin therefore measures the economics of delivering NVIDIA products before research, sales and corporate costs.
Operating expenses
Research and development expense was $7.05 billion, or 7.3% of revenue. Selling, general and administrative expense was $1.35 billion, or 1.4% of revenue. Total operating expenses were $8.41 billion.
Because revenue grew much faster than operating expenses, operating income reached $63.73 billion. The resulting 66.2% operating margin is the clearest measure of the core product business this quarter.
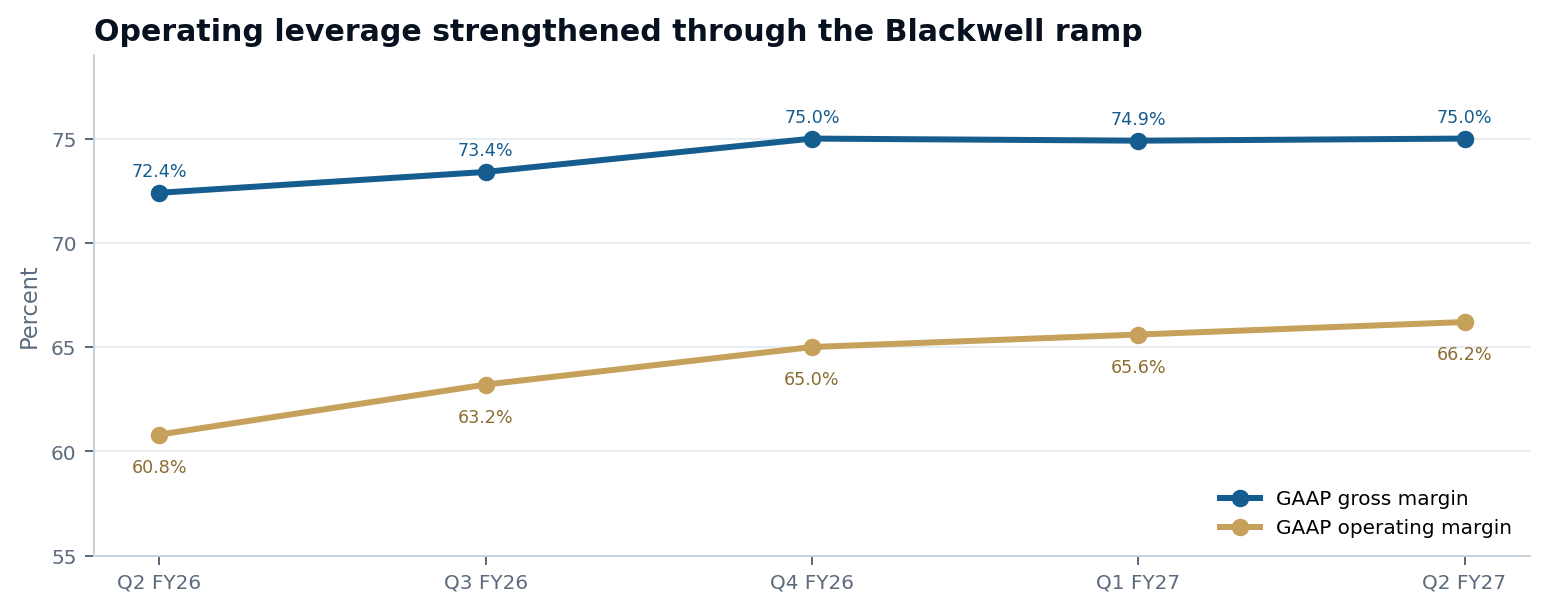 NVIDIA gross margin and operating margin trend
NVIDIA’s gross margin reached 75.0%, while operating margin expanded to 66.2% as revenue grew faster than operating expenses.
GAAP EPS was valid, but not fully recurring
NVIDIA reported GAAP EPS of $2.46 and non-GAAP EPS of $2.22. The difference of $0.24 per share represented approximately 9.8% of GAAP EPS.
The largest adjustment was related to gains on equity securities. NVIDIA recorded approximately $7.77 billion of other income in Q2, mostly from investment-related gains. These gains are legitimate accounting income, but they should not be valued like repeatable profit from selling AI systems.
The reconciliation was:
Earnings bridge Amount GAAP net income $59.69B Less: net pre-tax non-GAAP adjustments ($7.25B) Add: tax effect of adjustments $1.52B Non-GAAP net income $53.95B There is also an important accounting change. Beginning in Q1 FY2027, NVIDIA’s non-GAAP measures no longer exclude stock-based compensation. The current non-GAAP figure is therefore more conservative than the company’s older presentation, although historical comparisons still require care.
For valuation, recurring operating income and non-GAAP EPS are better anchors than GAAP net income alone. For cash-quality analysis, investors should use operating cash flow and free cash flow.
Balance sheet explained
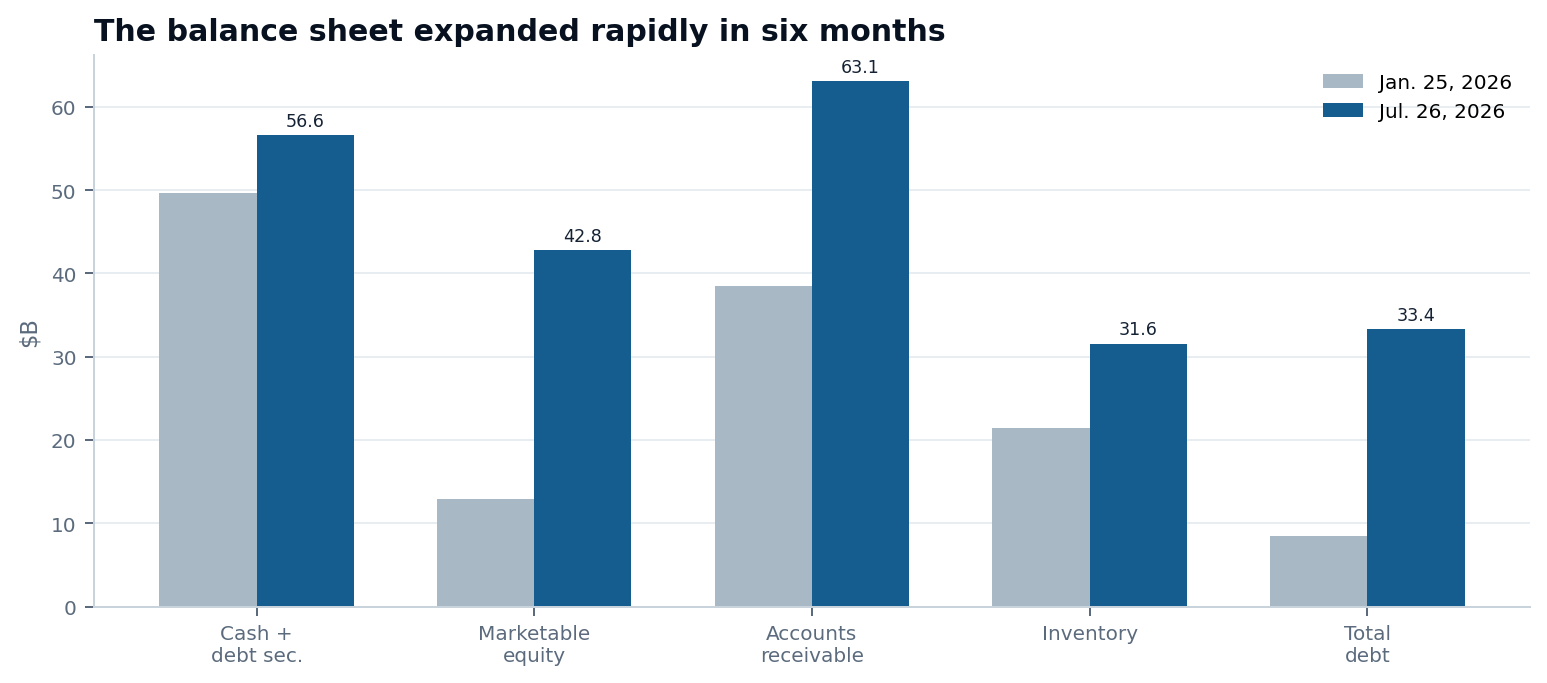
NVIDIA’s balance sheet remains highly liquid, but its composition changed rapidly during the first half of FY2027.
At July 26, 2026:
Balance-sheet item Amount Change from January 2026 Cash $22.44B +112% Marketable debt securities $34.14B -13% Marketable equity securities $42.78B +232% Accounts receivable $63.06B +64% Inventory $31.58B +48% Total assets $320.27B +55% Total debt $33.37B +294% Shareholders’ equity $228.98B +46% Cash plus marketable debt securities totaled $56.59 billion. After subtracting debt of $33.37 billion, NVIDIA had approximately $23.22 billion of core net cash, excluding its marketable and non-marketable equity investments.
The current ratio was approximately 4.59 times, indicating substantial short-term liquidity. Debt represented approximately 14.6% of shareholders’ equity.
 NVIDIA balance-sheet liquidity, investments, receivables, inventory and debt
Liquidity remains strong, but receivables, inventory, equity investments and debt all increased materially.
The balance sheet is not simply becoming more leveraged. It is becoming more financially connected to the AI ecosystem through investments, longer customer terms, supply reservations, cloud agreements, leases and guarantees.
Cash-flow statement explained
Net income is an accounting measure. Operating cash flow shows how much cash the business generated after adjusting for non-cash items and working-capital movements. Free cash flow subtracts capital expenditures and selected principal payments from operating cash flow.
In Q2 FY2027:
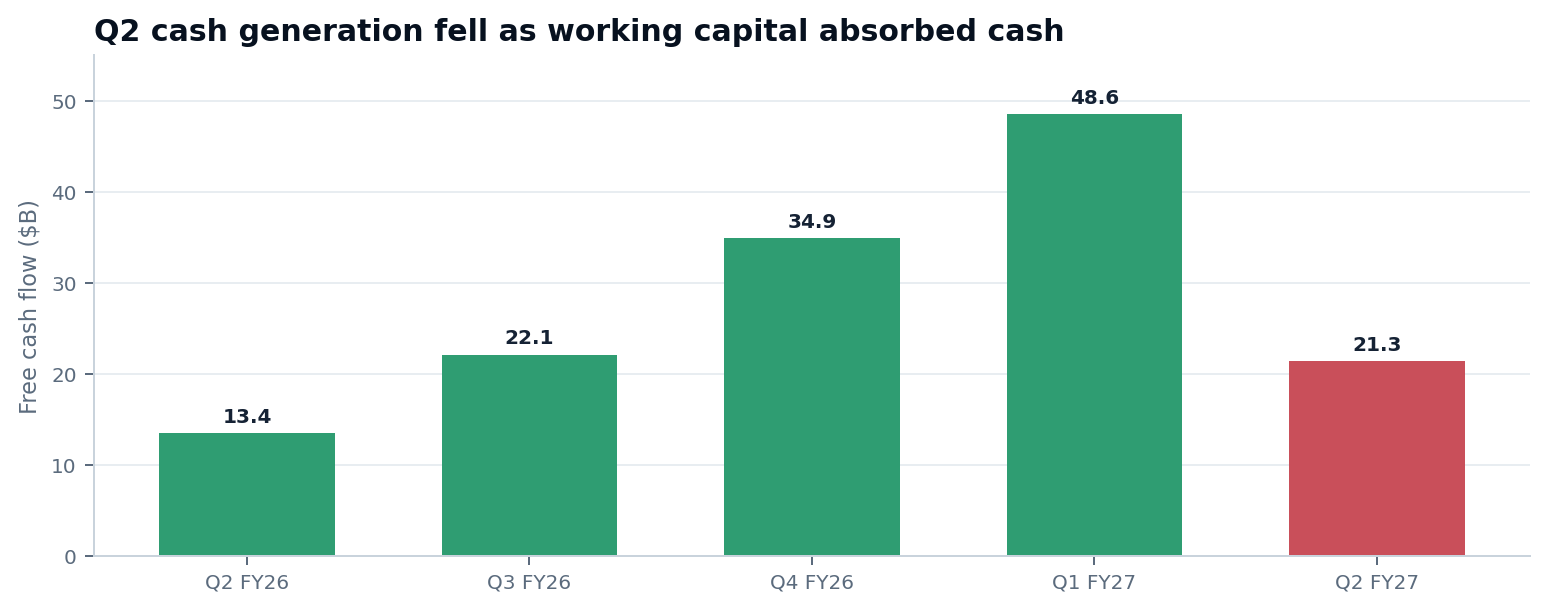
Cash-flow item Amount Operating cash flow $24.08B Capital expenditures and intangible purchases ($2.68B) Principal payments ($0.06B) Free cash flow $21.34B Free-cash-flow margin 22.2% Free cash flow fell from $48.55 billion in Q1 to $21.34 billion in Q2. This was not caused by weak operating profit. It was primarily a working-capital issue.
 NVIDIA quarterly free cash flow trend
Q2 free cash flow fell sharply even as revenue and operating profit increased.
The largest Q2 cash uses were:
- Accounts receivable: approximately $22.35 billion.
- Inventory: approximately $5.78 billion.
- Prepaid expenses and other assets: approximately $5.50 billion.
Accounts payable and other liabilities partially offset those cash uses. The net working-capital effect was approximately $30.71 billion.
For the first half of FY2027, NVIDIA generated $74.42 billion of operating cash flow and $69.90 billion of free cash flow. The six-month result is less volatile than a single quarter, but cash conversion still needs to be monitored.
Receivables and inventory are the main cash-quality signals
Accounts receivable reached $63.06 billion, up 54.9% sequentially, while revenue increased 17.9%. Days sales outstanding rose to approximately 60 days, compared with 45 days in Q1 according to management.
The increase partly reflects large multi-quarter customer agreements and extended payment terms. NVIDIA disclosed that some investment-grade customers receive payment terms ranging from 90 days to one year.
Customer concentration also matters. The five largest receivable exposures represented approximately 70% of accounts receivable. One direct customer represented 16% of Q2 revenue.
Inventory reached $31.58 billion. Raw-material inventory was $11.34 billion, work in process was $13.38 billion, and finished goods were $6.86 billion. Raw materials increased almost threefold from the fiscal-year end, consistent with the company securing supply for future product ramps.
The benign interpretation is that NVIDIA is financing a rapid deployment cycle and reserving constrained components. The negative interpretation is that customer financing, inventory risk and cash absorption are becoming structural. The next two quarters should help distinguish between those outcomes.
Growth outlook: Blackwell, Vera Rubin and platform breadth
Management expects Q3 FY2027 revenue of $108 billion, plus or minus 2%. The guidance assumes no Data Center compute revenue from China.
The most important forward drivers are:
Vera Rubin
Management said production shipments began during Q3 and expects Vera Rubin to represent approximately 20% of Q3 Data Center revenue. The ramp will test supply availability, system yields, pricing and customer deployment speed.
Networking
Networking reached another record quarter and grew 18% sequentially according to management. Spectrum-X revenue increased 2.6 times year over year. Networking is strategically important because AI clusters require high-speed scale-up and scale-out connectivity, not only accelerators.
CPUs
Management stated that Grace CPU revenue exceeded $5 billion on a trailing-twelve-month basis and expects CPU revenue to more than double in FY2028. CPU adoption would increase NVIDIA’s share of each AI-factory deployment.
AI Clouds, Industrial and Enterprise
This category grew faster than Hyperscale in Q2. Continued growth would show that demand is broadening beyond the largest cloud platforms. Investors should still examine who ultimately funds and uses the deployed capacity.
Long-range outlook
Management expects approximately 70% revenue growth in FY2028 and described the outlook as supply-constrained. This is a company forecast, not verified demand. Our base valuation scenario deliberately uses 60% growth to reflect execution, supply and financing risk.
Capital commitments and guarantees
NVIDIA is using its balance sheet to accelerate the AI infrastructure buildout. This can secure scarce supply and unlock customer deployments, but it creates risks that do not appear in a simple price-to-earnings ratio.
The July 2026 Form 10-Q disclosed:
Disclosure Amount Interpretation Primary commitment table $366B Includes supply, capacity, cloud services, leases, equity investments and capex Supply and capacity commitments $279B Primarily supports future product availability Additional AI-cloud agreements $36B Declines as capacity is used by customers or NVIDIA Third-party leases not commenced $20B Long-duration leases expected to be reassigned Equity investment commitments $25B Future strategic investment funding Land, power and shell guarantees $3.5B Maximum gross exposure for selected AI-cloud partners SB Energy and OpenAI guarantees $105B cumulative cap Conditional support for an initial 4.25 GW project 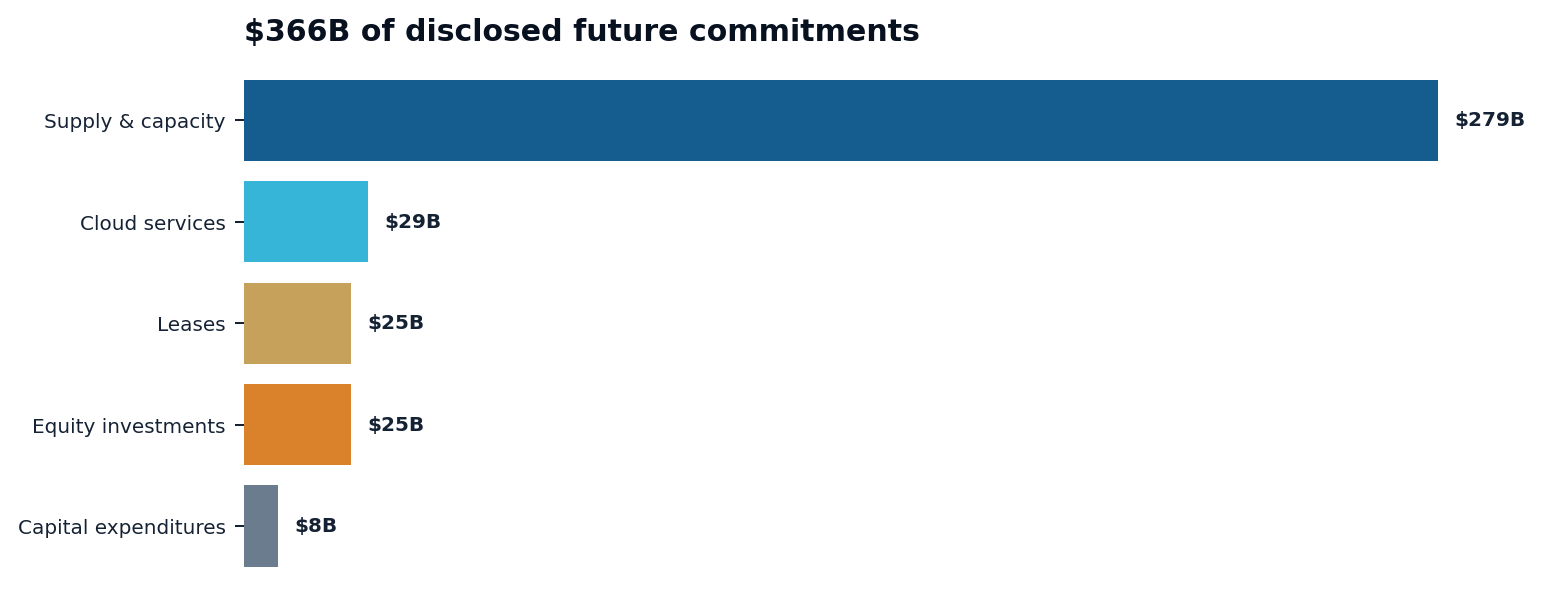 NVIDIA disclosed future capital commitments
The $366 billion table should not be added mechanically to the other disclosed amounts because overlap has not been fully confirmed.
The $105 billion SB Energy guarantee deserves separate treatment. It is a cumulative contractual cap, not a current funded liability. The guarantees phase in as nine leases commence, with the first phase expected in FY2029. Payment is triggered by specified OpenAI defaults and a shortfall after a replacement lease or sale. OpenAI agreed to reimburse and indemnify NVIDIA for amounts paid.
The economic risk depends on construction timing, lease commencement, OpenAI’s financial capacity, recovery values and the collectability of the indemnity. NVIDIA’s Form 8-K describing the SB Energy agreement provides the controlling terms.
Competitive advantage and the main threats
NVIDIA’s moat is a platform, not one chip.
- CUDA software: A broad developer ecosystem, optimized libraries and model support reduce switching incentives.
- Full-stack systems: GPUs, CPUs, networking, rack-scale systems and software are designed together.
- Supply-chain scale: Large commitments can secure constrained foundry, packaging and memory capacity.
- Cross-cloud fungibility: NVIDIA capacity can serve many models, customers and workloads.
- Ecosystem support: Financing and infrastructure commitments can accelerate deployment.
The principal competitive threat is custom silicon. Hyperscalers and AI companies are motivated to reduce dependence on NVIDIA and improve the economics of stable, high-volume workloads. Custom accelerators can be competitive in selected inference use cases even if NVIDIA remains stronger across diverse workloads and cloud environments.
Investors can compare NVIDIA with AMD research and track the memory supply chain through Micron research. Large cloud customers such as Microsoft are also relevant because their infrastructure spending influences accelerator demand.
China remains another structural risk. Q2 China Data Center compute shipments represented less than 1% of Data Center revenue, and Q3 guidance assumes no China Data Center compute revenue. The immediate revenue exposure is limited, but the long-term risk is that restrictions accelerate competing hardware and software ecosystems.
What the share price already assumes
The valuation framework uses the August 26, 2026 closing price of $209.66 as a stable reference. At that price, diluted shares of approximately 24.285 billion imply a market capitalization of about $5.09 trillion. Live values on the NVIDIA valuation page will change with the share price.
GAAP trailing price-to-earnings was approximately 26.3 times at the reference price, but GAAP EPS was boosted by investment gains. Annualizing Q2 non-GAAP EPS of $2.22 produces a simple run-rate multiple of approximately 23.6 times. This is not a formal forward estimate because quarterly earnings and margins will change.
A reverse valuation asks what earnings must be delivered to justify the current price under different multiples:
Assumed FY2028 P/E Required EPS Approx. recurring net income Approx. revenue at 52% net margin 18x $11.65 $283B $544B 24x $8.74 $212B $408B 30x $6.99 $170B $326B At a 24-times multiple, the reference price requires approximately $408 billion of revenue at the assumed 52% recurring net margin. That is below the base scenario, meaning the August 26 closing price discounts a significant miss versus management’s FY2028 growth outlook, provided margins remain strong.
This conclusion is highly sensitive to the valuation multiple. A lower multiple can offset substantial earnings growth.
Bear, base and bull valuation scenarios
These scenarios are internal BE THE INVESTOR estimates, not company guidance or analyst consensus.
Scenario FY2027 revenue FY2028 growth FY2028 revenue Gross margin FY2028 EPS P/E Implied value Bear $395B 15% $454B 67% $8.08 18x $145 Base $408B 60% $653B 72% $14.40 24x $346 Bull $422B 75% $739B 74% $17.60 28x $493 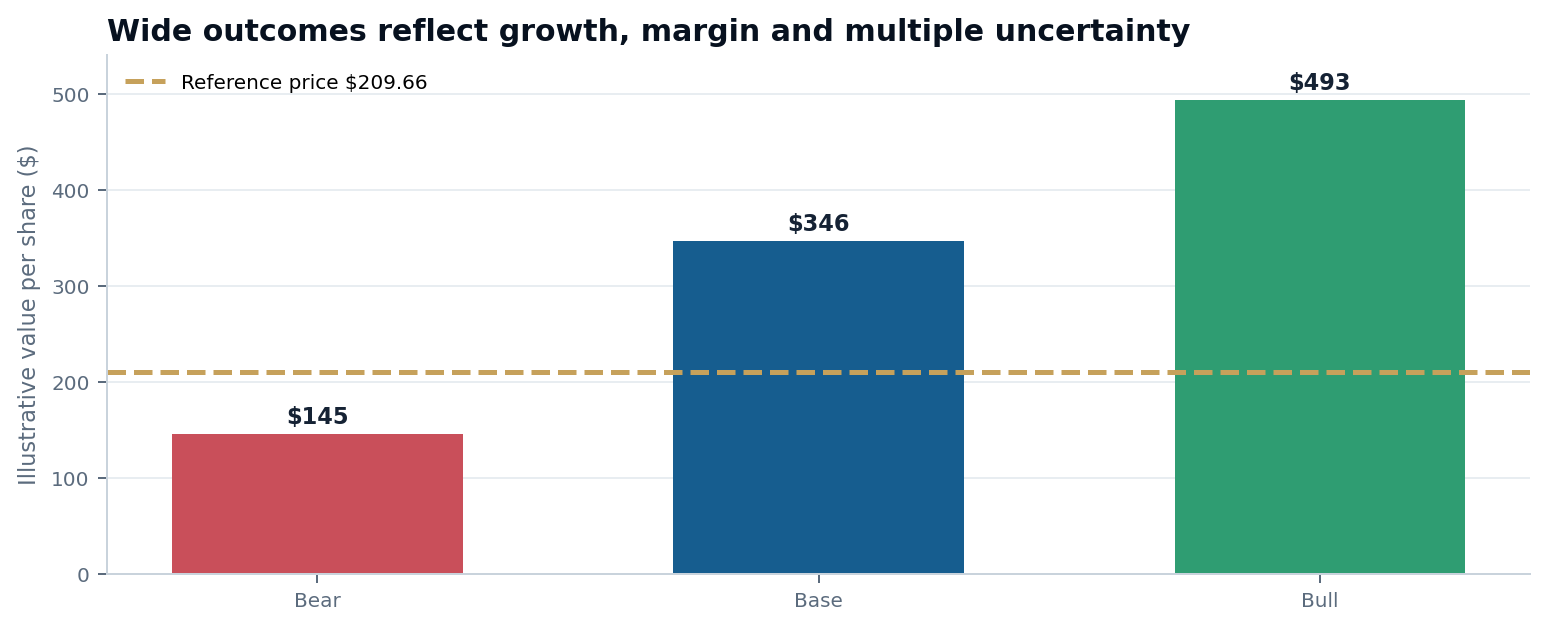 NVIDIA FY2028 bear, base and bull valuation scenarios
Illustrative valuation scenarios compared with the August 26 closing price of $209.66.
The range is intentionally wide. The bear case shows substantial downside if growth decelerates sharply, gross margin resets and the market assigns a mature-company multiple. The base and bull cases show large upside if management converts supply visibility into delivered systems while preserving extraordinary margins.
The correct use of the scenarios is not to select the highest target. It is to update the assumptions as new evidence arrives. Investors can test their own inputs with the BE THE INVESTOR valuation calculator.
Main risks
- Growth commitments do not convert into revenue. Supply reservations, cloud agreements and leases can absorb capital without producing adequate customer cash flow.
- Gross margin falls further than expected. Memory, networking and system costs could pressure margins beyond management’s stated trough.
- Custom accelerators gain economic share. Large customers may shift stable workloads to internally designed chips.
- Receivables continue growing faster than revenue. Longer payment terms could weaken cash conversion and increase credit exposure.
- Inventory becomes mismatched with demand. Product transitions and export restrictions can create provisions or write-downs.
- Investment and guarantee losses. Equity impairments, defaults, lease obligations or indemnity shortfalls could consume cash.
- China and export controls. Restrictions can reduce the addressable market and strengthen competing ecosystems.
- Valuation compression. The stock can decline even if earnings grow when the market applies a lower multiple.
Catalysts and evidence to watch
Date or period Catalyst Positive evidence Negative evidence September 10, 2026 Goldman Sachs technology conference Better visibility on Rubin, supply and commitments Higher support requirements or weaker margins October 21, 2026 GTC Berlin Broader product and ecosystem adoption Announcements without measurable economics Q3 FY2027 Vera Rubin revenue ramp Approximately 20% Data Center mix with stable execution Delays, yield problems or weak customer economics Q4 FY2027 Expected gross-margin trough 71%-72% trough followed by credible recovery Costs or pricing push margin below the range November 17, 2026 Q3 earnings call Revenue guide met and cash conversion improves Guide miss, rising DSO or commitments FY2028 planning Long-range growth test Supply supports approximately 70% growth with healthy returns Demand or financing fails to convert What investors should monitor every quarter
The highest-value monitoring dashboard is short:
- Total revenue and Data Center revenue.
- Hyperscale versus AI Clouds, Industrial and Enterprise growth.
- Vera Rubin revenue mix and system availability.
- Gross margin and operating margin.
- Accounts receivable, days sales outstanding and payment terms.
- Inventory, raw materials and purchase obligations.
- Operating cash flow and free-cash-flow conversion.
- Equity investments, impairments and commitments.
- Guarantees, lease assignments and customer defaults.
- China licensing and competitive product adoption.
Use the NVIDIA financials page to follow the statements, the NVIDIA analysis page for the current BTI view and the stock analysis tool for a broader research workflow.
Investment conclusion
NVIDIA remains the clearest large-scale beneficiary of global AI infrastructure spending. Q2 FY2027 proved exceptional demand, product breadth and operating leverage. It also showed why revenue growth alone is no longer sufficient for underwriting the stock.
The central question is whether NVIDIA can turn unprecedented supply, cloud and infrastructure commitments into recurring customer cash while preserving margins. If Vera Rubin ramps successfully, receivables normalize and free-cash-flow conversion recovers, the base-case earnings path can justify material upside from the August 26 reference price. If commitments grow faster than cash returns, the business may remain strong while the stock produces weaker returns.
The research stance is therefore constructive, but valuation-sensitive. The operating thesis is stronger. The cash-quality and balance-sheet-financing thesis still requires proof.
Download the full 18-page report: BE THE INVESTOR NVIDIA Q2 FY2027 Investment Research.
Frequently asked questions
What was NVIDIA’s Q2 FY2027 revenue?
NVIDIA reported Q2 FY2027 revenue of $96.22 billion, up 106% year over year and 18% sequentially. Data Center contributed $89.02 billion.
Why was NVIDIA’s Q2 free cash flow lower?
Free cash flow fell to $21.34 billion because accounts receivable, inventory and other working-capital items absorbed approximately $30.71 billion of cash. Operating profit remained exceptionally strong.
What is the difference between NVIDIA’s GAAP and non-GAAP EPS?
GAAP EPS was $2.46 and non-GAAP EPS was $2.22. The main difference was investment-related gains included in GAAP earnings but removed from the recurring non-GAAP earnings measure.
How strong is NVIDIA’s balance sheet?
NVIDIA had $56.59 billion of cash and marketable debt securities and $33.37 billion of debt at July 26, 2026. Core net cash was approximately $23.22 billion, excluding equity investments. Liquidity is strong, but commitments and contingent guarantees are large.
What is NVIDIA’s biggest financial risk?
The main financial risk is that supply, cloud, lease and guarantee commitments grow faster than customer cash generation. Receivables, DSO, free-cash-flow conversion and guarantee exposure are the most important indicators.
Is NVIDIA stock undervalued after Q2 FY2027?
There is no single answer because the result depends on FY2028 growth, margins and the valuation multiple. The internal scenarios range from $145 in the bear case to $493 in the bull case, with a $346 base-case value. These are estimates, not guaranteed targets.
What will drive NVIDIA’s next phase of growth?
The main drivers are the Vera Rubin ramp, networking, Grace CPUs, broader AI-cloud and enterprise demand, and increased revenue captured per AI-factory deployment.
Primary sources
- NVIDIA Q2 FY2027 earnings release, August 26, 2026.
- NVIDIA Q2 FY2027 Form 10-Q, filed August 26, 2026.
- NVIDIA Form 8-K covering the SB Energy and OpenAI guarantees, August 17, 2026.
- NVIDIA Q2 FY2027 earnings call transcript, August 26, 2026.
- Reuters post-earnings market report, August 27, 2026.
Disclosure
This article is independent general research prepared by BE THE INVESTOR for educational and analytical use. It is not personalized investment advice, an offer, a solicitation or a guarantee of future performance. Reported facts are tied to the cited sources. Forward scenarios are model-derived estimates and should be updated as new filings and market data become available.