Applied Optoelectronics’ share-price decline sits beside an operating acceleration that is unusually sharp. Second-quarter 2026 revenue reached $191.9 million, up 86% from a year earlier and 27% sequentially. Management then guided third-quarter revenue to $255 million to $290 million, implying another 33% to 51% sequential increase.
The driver is 800-gigabit optical transceivers used to connect AI and cloud infrastructure. The company said 800G volume more than doubled from the first quarter and that demand could exceed its production capacity through mid-2027. AAOI was approaching 200,000 units of monthly capacity and targeted roughly 650,000 by year-end—a more than threefold increase in a matter of months.
The earnings leverage is visible but incomplete
AAOI’s second-quarter GAAP gross margin was 27.7%. The company still posted a GAAP net loss of $22.8 million, or $0.28 per share, while non-GAAP net income was $5.5 million, or $0.06 per share. Third-quarter guidance called for a non-GAAP gross margin of 29% to 30.5% and non-GAAP income of $10.1 million to $24 million.
At the midpoint of revenue guidance, $272.5 million, the midpoint gross-margin guide of 29.75% would imply about $81.1 million of non-GAAP gross profit before operating expenses. That is BTI analysis, not company guidance beyond the stated revenue and margin ranges. It shows why the capacity ramp matters: higher throughput can spread fixed manufacturing costs, but only if yields and pricing hold.
Why a bullish target is not the thesis
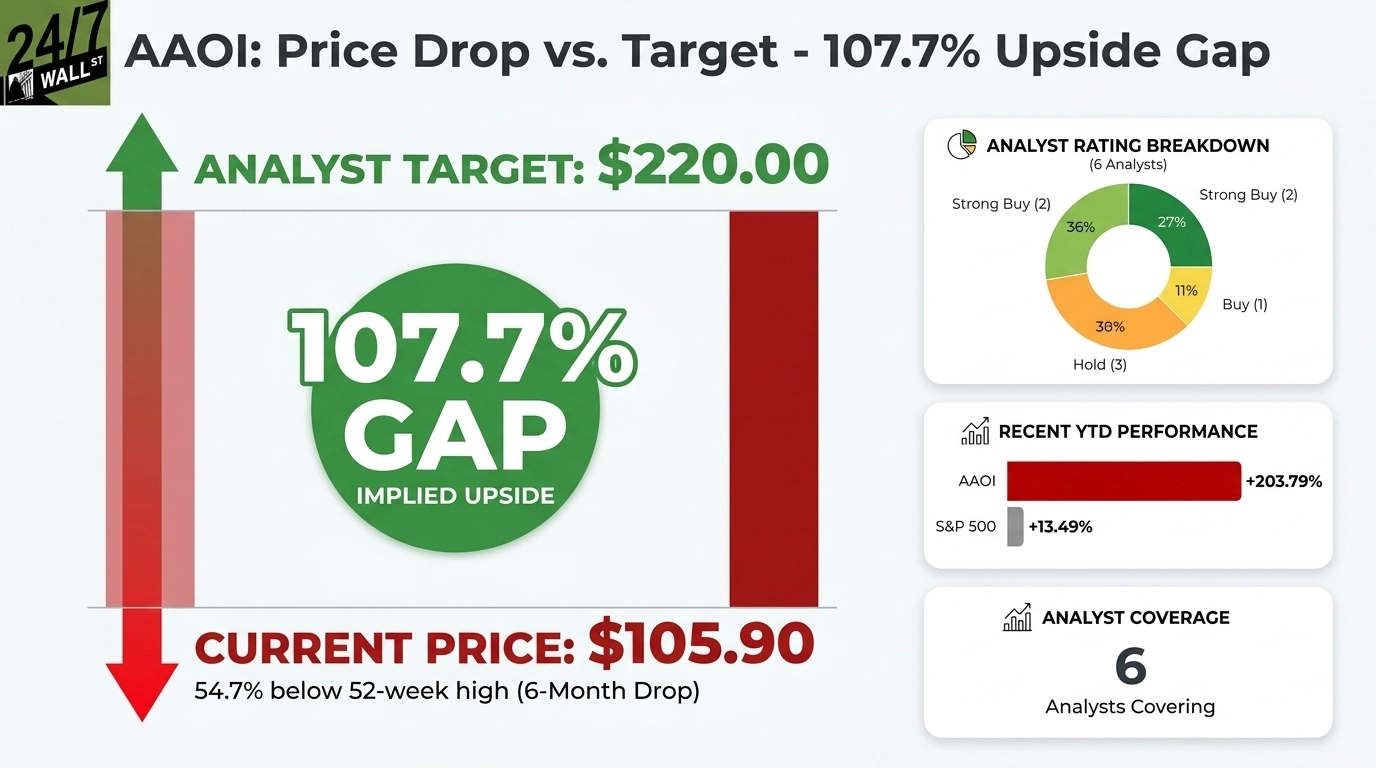
An analyst’s expectation that the shares could double is an opinion about valuation, not evidence that capacity will convert into cash. AAOI identifies customer concentration, production execution, order reductions and pricing pressure among its risks. A large customer can delay deployment or qualify a second supplier, leaving new equipment underused. Rapidly installed capacity can also depress returns if manufacturing yields disappoint.
The opposite scenario is powerful. If demand remains above capacity, AAOI can sell more units while improving utilization and gross margin. The Q3 guidance suggests that operating leverage is beginning to appear, and a shortage of high-speed optics can support pricing. Investors should still separate a cyclical shortage from a durable competitive advantage.
The next decisive disclosure is the relationship between volume, gross margin and cash. Revenue growth accompanied by sustained margin expansion and positive operating cash flow would validate the investment in capacity. Revenue growth with flat margins or rising working capital would indicate that AAOI is financing customers and factories faster than it is creating economic profit.
The share count is another economic variable. AAOI based its third-quarter non-GAAP EPS guidance on roughly 92.8 million diluted shares, so per-share gains can lag profit growth if equity issuance or stock compensation expands the denominator. Investors should compare absolute income, cash flow and diluted shares rather than rely on an EPS headline alone.
Working capital can also absorb cash during a manufacturing ramp. More capacity usually means purchasing components, carrying work in process and extending receivables before customers pay. A profitable income statement can therefore coexist with weak free cash flow for a period. That is not automatically a problem, but it becomes one if demand normalizes before inventory turns into cash.
The midpoint of AAOI’s Q3 non-GAAP income guide is $17.05 million. Against the $272.5 million midpoint revenue estimate, that is a 6.3% implied net margin. The calculation highlights both the leverage and the fragility: small changes in component cost, yield or selling price can move a thin net margin quickly. Capacity utilization, not capacity announcements, will decide whether the upside target is justified.